How to Read the Stat Force
The Stat Force is designed to augment the Stat Attack. The Stat Force is an extension that will help you uncover the important information you need. To help introduce you to the Stat Force, we will go through the sheet on a column-by-column basis and explain how all of the greyhound statistics are produced. We will share some hints about using the Stat Force to uncover information you may never have considered before.
Section #1: Track Statistics
The first four columns of the Stat Force (left of the first vertical line) are statistics about the track and not about the individual greyhounds. The statistics are broken out by post position, showing you information about the boxes themselves, and about the track biases that you are facing. All of the track-based statistics are based on a rolling 20-week time period. (The 20 weeks is approximate.) The time period rolls forward every day, so the
information in the Stat Force is always fresh and up-to-date.
Another innovation on the Stat Force is to break out these statistics by both distance and grade. You know as a handicapper that Maiden races aren’t the same as grade A contests. The track biases are different for every grade, and of course for every distance. Experienced dogs have different break skills than Maiden runners. And lower grade dogs may not handle the first turn, or early bumping in the same way as older dogs. The possibilities are great here, and the Stat Force will show you opportunities you have never had available before.
Post Bias Finish (Post Bias for the Finish Position):
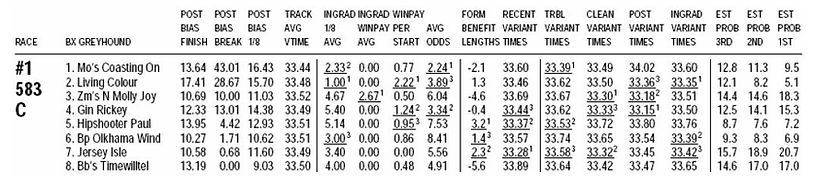
The first column on the Stat Force shows you the “finish” track bias. This is the winning percentage for each post position. So if you see “13.19” for the #8 dog, it means that the #8 box has won 13.19% of the time in recent races. If your track is running eight-dog races, then the normal expectations for winning would be 12.50% for each box. If a box shows 17.41 here, it means that position 2 wins far more often than you would expect from just random chance. Generally this means that the post position has some hidden benefit for any greyhound starting there. On the other hand, if the number is below 12.50, that post position is a disadvantage for the dog.
POST BIAS BREAK (Post Bias for the Break Call):
The second column looks at how each box helps or hinders the greyhounds in their break. The break call on the program is normally made just after the greyhounds clear the starting boxes. On the Stat Force, if you see “13.01” in this column for box #4, it means that in 13.01% of recent races, the dog starting from that #4 box broke first. That is, the dog in the #4 box is the fastest breaker in 13.01% of the races. Again, the expectation is 12.50% for any given post position if the starting boxes had no break bias. One warning here should be noted. At many tracks, the chartwriter doesn’t have a straight-on view of the starting boxes. The camera that views the beginning of the race is normally far down the track and set at an angle to the starting boxes. This often produces a “camera bias” where the chartwriter honestly ranks the dogs as he sees them, but that ranking is affected by the angle of the camera. At many tracks this is a very strong effect. And without the Stat Force, you would never know the situation at your own track!
POST BIAS 1/8 (Post Bias for the 1/8th Call):
This column is much like the previous column, except it looks at the bias at the 1/8th-call instead of at the break. So the percentage for each box shows how often the dog in that post position is in first place at the 1/8th call, which is usually taken right after the first turn. Again, numbers larger than 12.50% show a favorable bias for a box. Numbers under 12.50 hint that the post position is working against the runner at the 1/8th call. Once again, the 1/8th bias may be a real effect of the post position, or it may be a bias introduced by the camera. In any case, you now have a tool to study this factor.
TRACK AVG VTIME (Track Average Variant-Adjusted Time):
Here you are shown the difference in speed bias for each box, for every grade and distance. This number is the average variant-adjusted time for all dogs starting from each post position in recent races. (Variant-adjusted times are times that have been normalized to take care of fast and slow days on the track. This adjustment makes times more comparable between days and over long time periods.) With this information, you can see exactly how much speed benefit a greyhound will enjoy in its post position in this race. A lower time is faster, obviously, and you can compare easily by looking at the differences in the times. Keep in mind that a difference of 0.07 seconds is about one length. The post position with the lowest number has given those dogs starting from that box some speed advantage in the recent past.
Section #2: Statistics for Individual Greyhounds
All of the numbers to the right of the first vertical line are statistics about the greyhounds themselves. These are
numbers that show you information about the runners in today’s races. These stats will let you directly compare
the skills and attributes of the dogs that are competing in each contest. For these statistics, we use about twenty
past performance lines for each greyhound.
INGRAD 1/8 AVG (In-Grade 1/8th Call Average):
Being first at the turn is a very important handicapping factor. Leaders after the turn have a very high win percentage and in-the-money percentage. On the Stat Force the “INGRAD 1/8 AVG” column gives you the average 1/8th-call for each greyhound. And the hidden value here is that we only use races for each dog that were at the same grade and distance as the current race. So if the #5 greyhound shows “5.14” it means that his average 1/8th-call position in his previous races AT THIS GRADE has average 5.14. Smaller numbers are better here. And like on our Stat Attack, the three runners with the best ingrade 1/8th average are underlined for you and ranked 1, 2, and 3. Normal expectation for an “average” dog would be 4.50 in this column. But your best use of this column is to directly compare the numbers among the greyhounds.
INGRAD WINPAY AVG (In-Grade Win Payoff Average):
Here you’ll find the average win payoff that each greyhound has earned for all races at this same grade and distance. If a greyhound shows “0.00” in this column, it means that dog has never won a race at this grade and distance. If you see a number like “2.67” it means that if you added up all the win payoffs for this dog at this grade and distance and divided them by the number of starts, the average win payoff has been $2.67 for this greyhound. For example, let’s say a greyhound had three races in today’s grade in the recent past. He was a winner in one of those races, and the win payoff was $6.60 as the dog’s odds were 2.30 in that race. He would have a score of “2.20” in this column today, because 6.60 divided by the three starts is $2.20. (This number may be especially valuable for higher-grade dogs. At grade A or grade AA, this is a pretty good measure of a dog’s “value” in earning win payoffs.)
WINPAY PER START (Average Win Payoff Per Start):
This statistic is much like the previous column, except here we use all of each dogs’ lines to get the average. This helps fill in the gaps for dogs that haven’t run before at this grade. And it helps when some of the dogs have fewer wins, giving you at least some information about payoffs for every runner.
AVERAGE ODDS:
Every greyhound has a final post-time odds number for every past performance. To draw information from this, we take each of those win odds and turn it into a percentage. For example, 2-1 odds imply a 33.33% win rate. And 3-1 odds imply a 25.00% win rate. Then we add up all of these percentages for each dog, and divide by their number of starts. Then we convert this back into an odds number. So this is a true and accurate odds average for each runner. This statistic allows you to see how the crowd has “rated” each greyhound in the past, on average, and lets you compare directly their historic odds levels.
Section #3: Form-Based Statistics
To the right of the second vertical line you will find two columns that give you information about each greyhound’s current form. Every handicapper looks at form in a different way. With the Stat Force, we’ve come up with a technique that gives you a quick indication whether any greyhound has been doing better recently or worse than his overall average. To do this, we look at the last three starts for each runner. One statistic will let you directly compare recent effort between dogs. Another statistic will show you whether each greyhound is in good form or poor form compared to their own normal times.
FORM BENEFIT LENGTHS (Form Benefit in Lengths):
One aspect of form is to see how much each dog’s recent performance differs from their own overall performance envelope. While the next column lets you see how the eight dogs recent times compare, this FORM BENEFIT LENGTHS column tells you whether each greyhound is showing good form or poor form, and by exactly how much. For example, let’s say the #2 greyhound has “1.3” in this column. Any positive number means the runner has been better recently than overall in the past. The “1.3” means that he has averaged 1.3 lengths faster in his recent races compared to his 20-line career average. If the #1 runner has “-2.1” in this column, it means that he is slower by 2.1 lengths recently than overall in his career.
RECENT VARIANT TIMES (Recent Variant-Adjusted Time Average):
For this column, we take the average of the variant-adjusted time for the last three races for each dog. The top three runners by this measure are underlined and ranked for you. So you can use this column to directly compare dog’s most recent race times to see how they compare against each other. This falls under the idea that a dog’s most recent races are more interesting than his races farther back. This provides you with a “recency” measure instead of longer time averages.
Section #4: Variant-Adjusted Time Statistics
The Stat Attack was the first product to offer the handicapper variant-adjusted time averages. Raw times—those
times reported in the results charts—are interesting, but they suffer from several drawbacks. First, everybody has the same times. They are printed in every program, so everybody sees the same times. People try to gain an
advantage by working the numbers differently, but there is a limit to what you can do with those six times.
On the Stat Attack, we introduced variant-adjusted times. Each day the track may run a little fast or a little slow.
Or sometimes if it is muddy, the track can run a lot slower! To fix this, we calculated an average winning time for
each distance and grade combination at the track. After a card has been run, we go back and look at the winners’
times and compare them with our standards. From this we can determine if the track was fast or slow that day,
and apply a correction factor to every time that was run by those greyhounds that day. These are then known as
variant-adjusted times.
This variant-adjustment by itself was a huge improvement over using raw times. But we took this one more step
and went back for up to twenty lines on each greyhound to give you a true picture of each dogs’ speed average.
This is the average that you’ve been using on the Stat Attack for nearly two decades.
Now the Stat Force, we’re introducing even more ways to use variant-adjusted times. These numbers are
exclusive and this hidden information may be your key to improving your own handicapping methods. Every
player wants information that most people don’t have—and the Stat Force supplies enough time-based
information to please nearly any time-oriented handicapper.
TRBL VARIANT TIMES (Variant-Adjusted Average for Lines with Trouble):
This column gives you each dog’s variant adjusted time average, but only for races where the dog encountered trouble. We define trouble by examining the comments supplied by the chartwriter for each past performance line. We look for issues like being blocked or getting bumped or having a collision, among other things. The greyhounds with the best performance in this measure are underlined and ranked for you, so you can directly compare their performance under stress. This stat shows you how your greyhound responds to adversity on the track.
CLEAN VARIANT TIMES (Clean Variant-Adjusted Time Average):
This is nearly the opposite of the previous statistic. Now we only look at races where the greyhound had a clean run. She didn’t have any bumps or collisions or problems. This stat is a good indication of a greyhound’s real potential. How fast can your dog go if she gets a perfect run? Now you can know.
POST VARIANT TIMES (Variant-Adjusted Time Average for this Post Position):
This is a great statistic because it supplies highly useful information that nobody else is likely to have. First, this statistic uses the entire lifetime past performance lines from this track for each greyhound. We do this because we are going to use only those lines where the greyhound started from the same box he’s in today, or the box on either side of today’s box. That is, if a greyhound is in the #6 box today, this column shows his variant-adjusted time average for those races 5 where he started from the #5, #6 and #7 boxes. If in the #1 box today, we use races from the #1 and #2 boxes. The same way, for the #8 runner today we would use his starts from the #7 and #8 boxes. This statistic shows you how each dog has done in the past when posted in the same (or nearly the same) position as he is in now. For this stat we widen it out to include the adjacent boxes because many greyhounds will have very few starts in this exact same box. Our experience with the post record column on the Stat Attack confirms the benefit of this strategy.
INGRAD VARIANT TIMES (In-Grade Variant-Adjusted Time Average):
Now we isolate how each greyhound has done is those races he or she has run in the same grade as today. This gives you a statistic that cleans up ambiguous information you get when a greyhound is rising in grade, or dropping in grade. The In-Grade Variant Times lets you compare the eight dog’s performance looking only at their starts in today’s grade. This helps you avoid time traps where dogs show slower times at higher grades, and faster times at lower grades. Once again you are getting hidden information that isn’t shown in the six or seven past performance lines on the daily program.
Section #5: Estimated Finish Probabilities
The final three columns on the Stat Force (To the right of the last vertical marker) are all estimated finish
probabilities. We’ve taken some of the new information from the Stat Force and the Racing Greyhounds Tipsheet
algorithm and further refined a technique called “Monte Carlo Simulation.” The result of this is an estimate of the
probabilities for each dog to finish in first place, second place, and third place. The right-most column (EST PROB 1ST) shows the win probabilities for each runner. For example, if you see a “20.7” for the #7 greyhound in this column, it means that we have estimated that the greyhound is likely to win this race about 20.7% of the time. If the number was “5.1” for the #2, it would mean we’ve calculated that the runner should win only 5.1% of the time. The random expectation for any greyhound finishing in any position is 12.5%.
The middle column (EST PROB 2ND) shows the probabilities for each dog to finish in exactly second place. The left column (EST PROB 3RD) shows what percentage of time each dog is likely to finish in third place. If you want to know the overall probability of any dog finishing in the money, just add up the three columns. So for the #4 greyhound, the 3rd/2nd/1st columns read 12.5/14.1/15.3 then you dog has an estimated in-the-money
probability of 41.9%.
This information can be very useful to handicappers with many kinds of wagering styles. For example, if you are
a key player, you can see how often your greyhound is likely to finish on top in the key. If you key a runner in
second or third, you have a measure of how often those wagers might win. Maybe you want to eliminate
greyhounds from a box, or from the bottom of a trifecta part wheel. The EST PROB 3RD column can show you
which runner has the least chance of finishing in the money.
These probability numbers are as accurate as possible based on our simulations. But these are only estimated
probabilities, and not actual observed statistics. You must understand their limitations, and remember that any
estimate—especially regarding greyhound racing—will not be perfectly accurate. As time goes on, we will closely monitor the performance of these simulations, and improve them whenever possible.